Supply monitoring
Once the monitoring agent is correctly installed and operating in the customers environment, the process takes place as follows: the data from the supplies in use by the printer is collected and sent to the cloud, where it is processed, and from which it is calculated indicators, as shown in the flow:
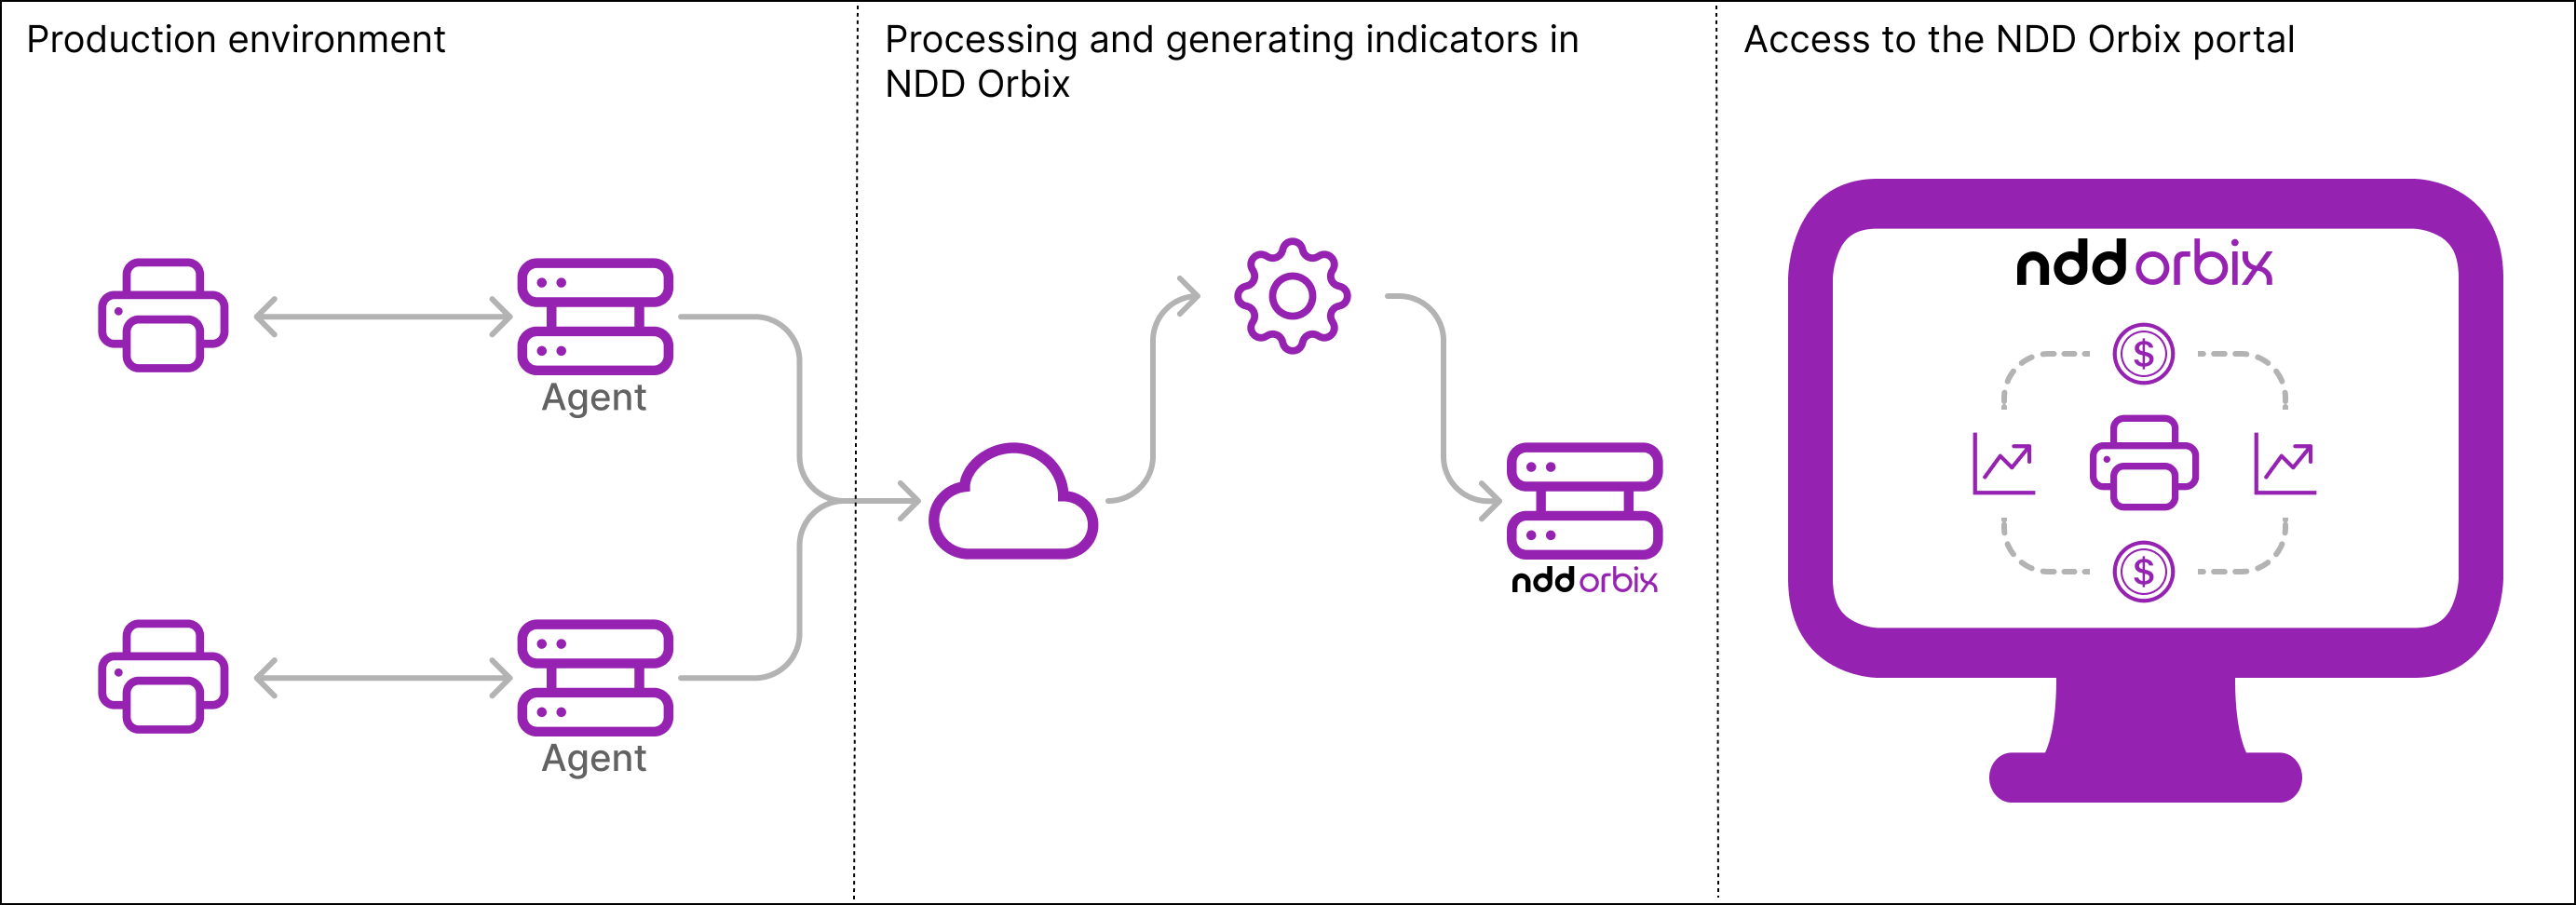
This information is listed in indicators to assist the provider in making decisions, in order to make the operation more profitable.
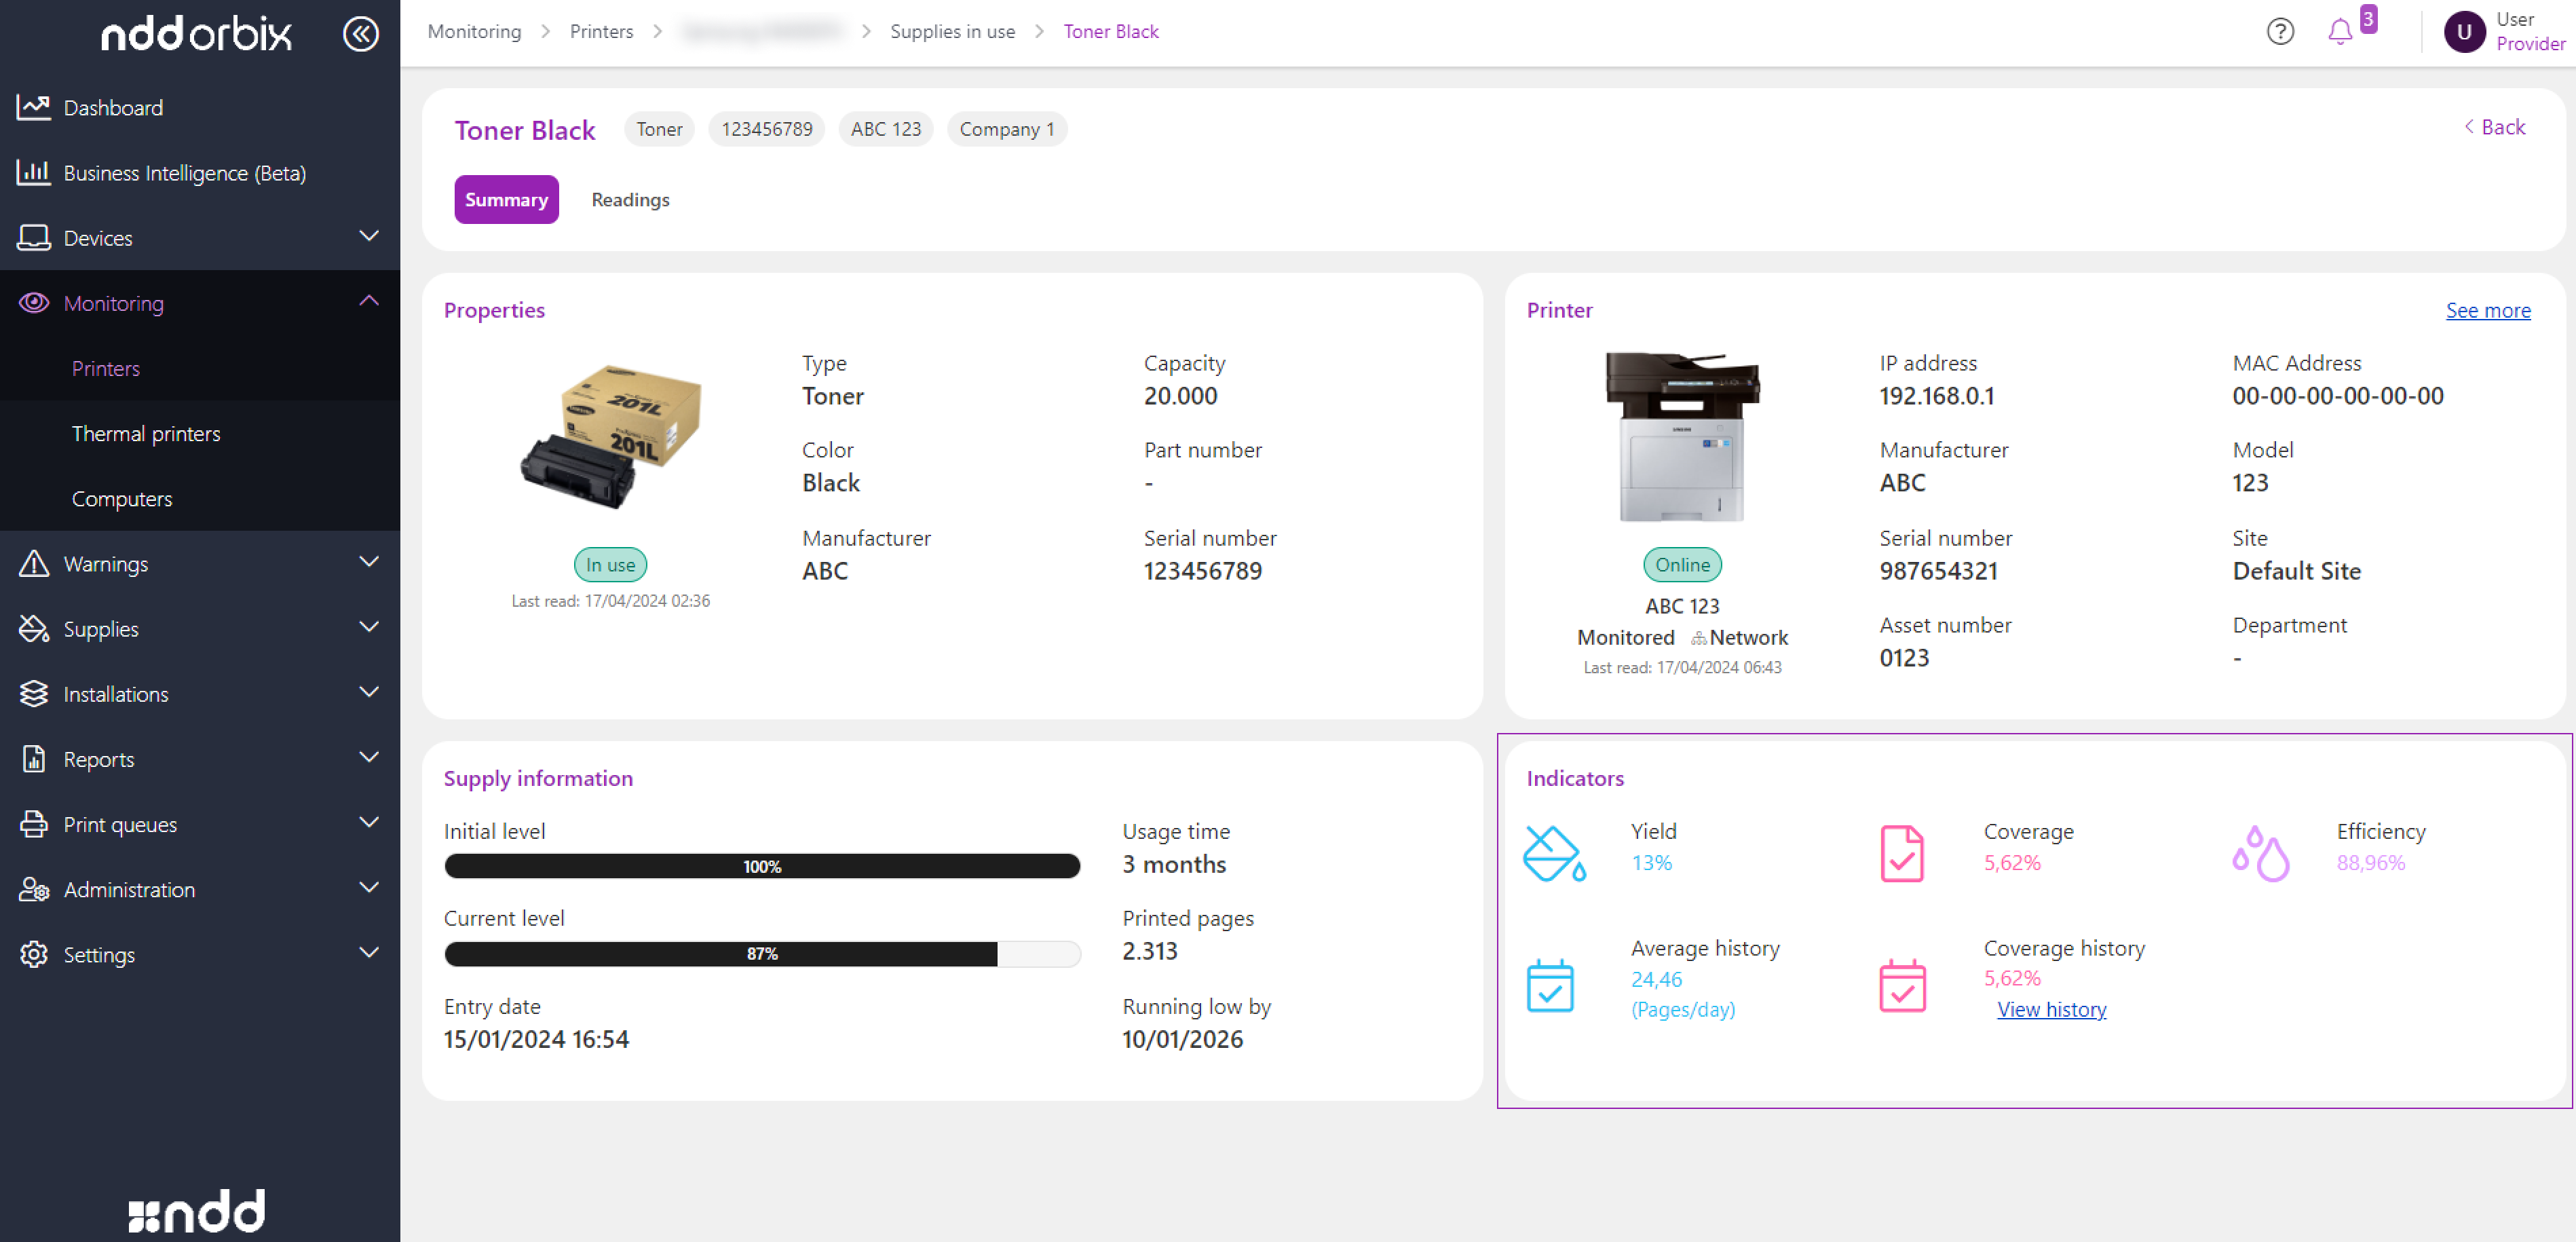
Supply information
To understand the importance of each piece of data and what it means, read the descriptions below:
Coverage
Coverage represents the amount of ink that was used on the printed page. The more ink used, the greater the coverage. So if in a print all the dots on the page have one pixel of ink, that means the printed coverage was 100%.
Coverage influences the printability of a supply. The manufacturer has an indication, which is usually 5% coverage, so they guarantee 100% supply capacity only if the average printed coverage is 5%.
We have a supply with a capacity of 100 pages.
If the coverage used is 5%, the supply will produce 100 pages.
If the coverage is 10%, it will only produce 50 pages, as double the ink suggested by the manufacturer is being used.
This indicator is something that greatly influences the provider's profitability, since the more ink is used, the less the supply yields, which means that the provider will have to replace it soon.
With the coverage indicator, the provider can monitor the environment's production and make decisions for the best profitability of the operation, such as creating contractual clauses for a coverage ceiling, in order to charge additional amounts when this is reached. In addition, it also helps the provider to know the behavior of printers and relocate them, replacing those with high coverage with more profitable equipment.
Efficiency
Efficiency is a complement to coverage that makes it easier to analyze, indicating how efficiently the supply was used. So, if we have a supply with a capacity of 100 pages and it has been used with a coverage of 10%, this means that it has only printed 50 pages. The efficiency indicator will therefore stand at 50%, indicating that it only produced half of what was expected. On the other hand, if this supply had printed with 2.5% coverage, it would mean that it had yielded 200%, twice as much as expected.
As in the case of coverage, this indicator can be used by the provider to assess the use of printers.
If the customer has a printer with a high supply cost and it is printing with a 50% efficiency, the provider can take the decision to replace the printer with a lower cost printer to reduce replacement costs.
Yield
The supply yield indicator is complementary to the efficiency indicator, and indicates what percentage of the available supply has been used.
So, if a supply enters the printer with a 50% level and leaves with 0%, it means that yield was 100%, because all the ink loaded was used up. If the supply goes in at 100% and comes out at 75%, for example, then production was 25%.
This indicator is used to monitor whether the toner has used up its entire level, and therefore, it helps the provider in monitoring the use of supplies and possible charging for waste.
Average pages printed per day
This indicator provides the average number of pages printed daily on the printer, this data gives the provider an understanding of the consumption profile of printers, and can help the customer in making decisions about the relocation of devices.
This indicator is also very important for replenishment of supplies, because based on it it is possible to predict the end date of a supply.
Running low by
The running low by indicator is used to get an idea of when the supply will run low. This indicator assists the provider in planning the replenishment of supplies, allowing them to ship the supply at the right time, preventing printers from downtime.
Supply replenishment
Depending on the agreement between the provider and the customer, it may be necessary to carry out a replacement service, which consists of sending supplies by the provider to ensure that the customer does not have printers stopped due to lack of supplies.
NDD Orbix assists the provider in this situation, providing alerts that will inform them that supplies are running low.
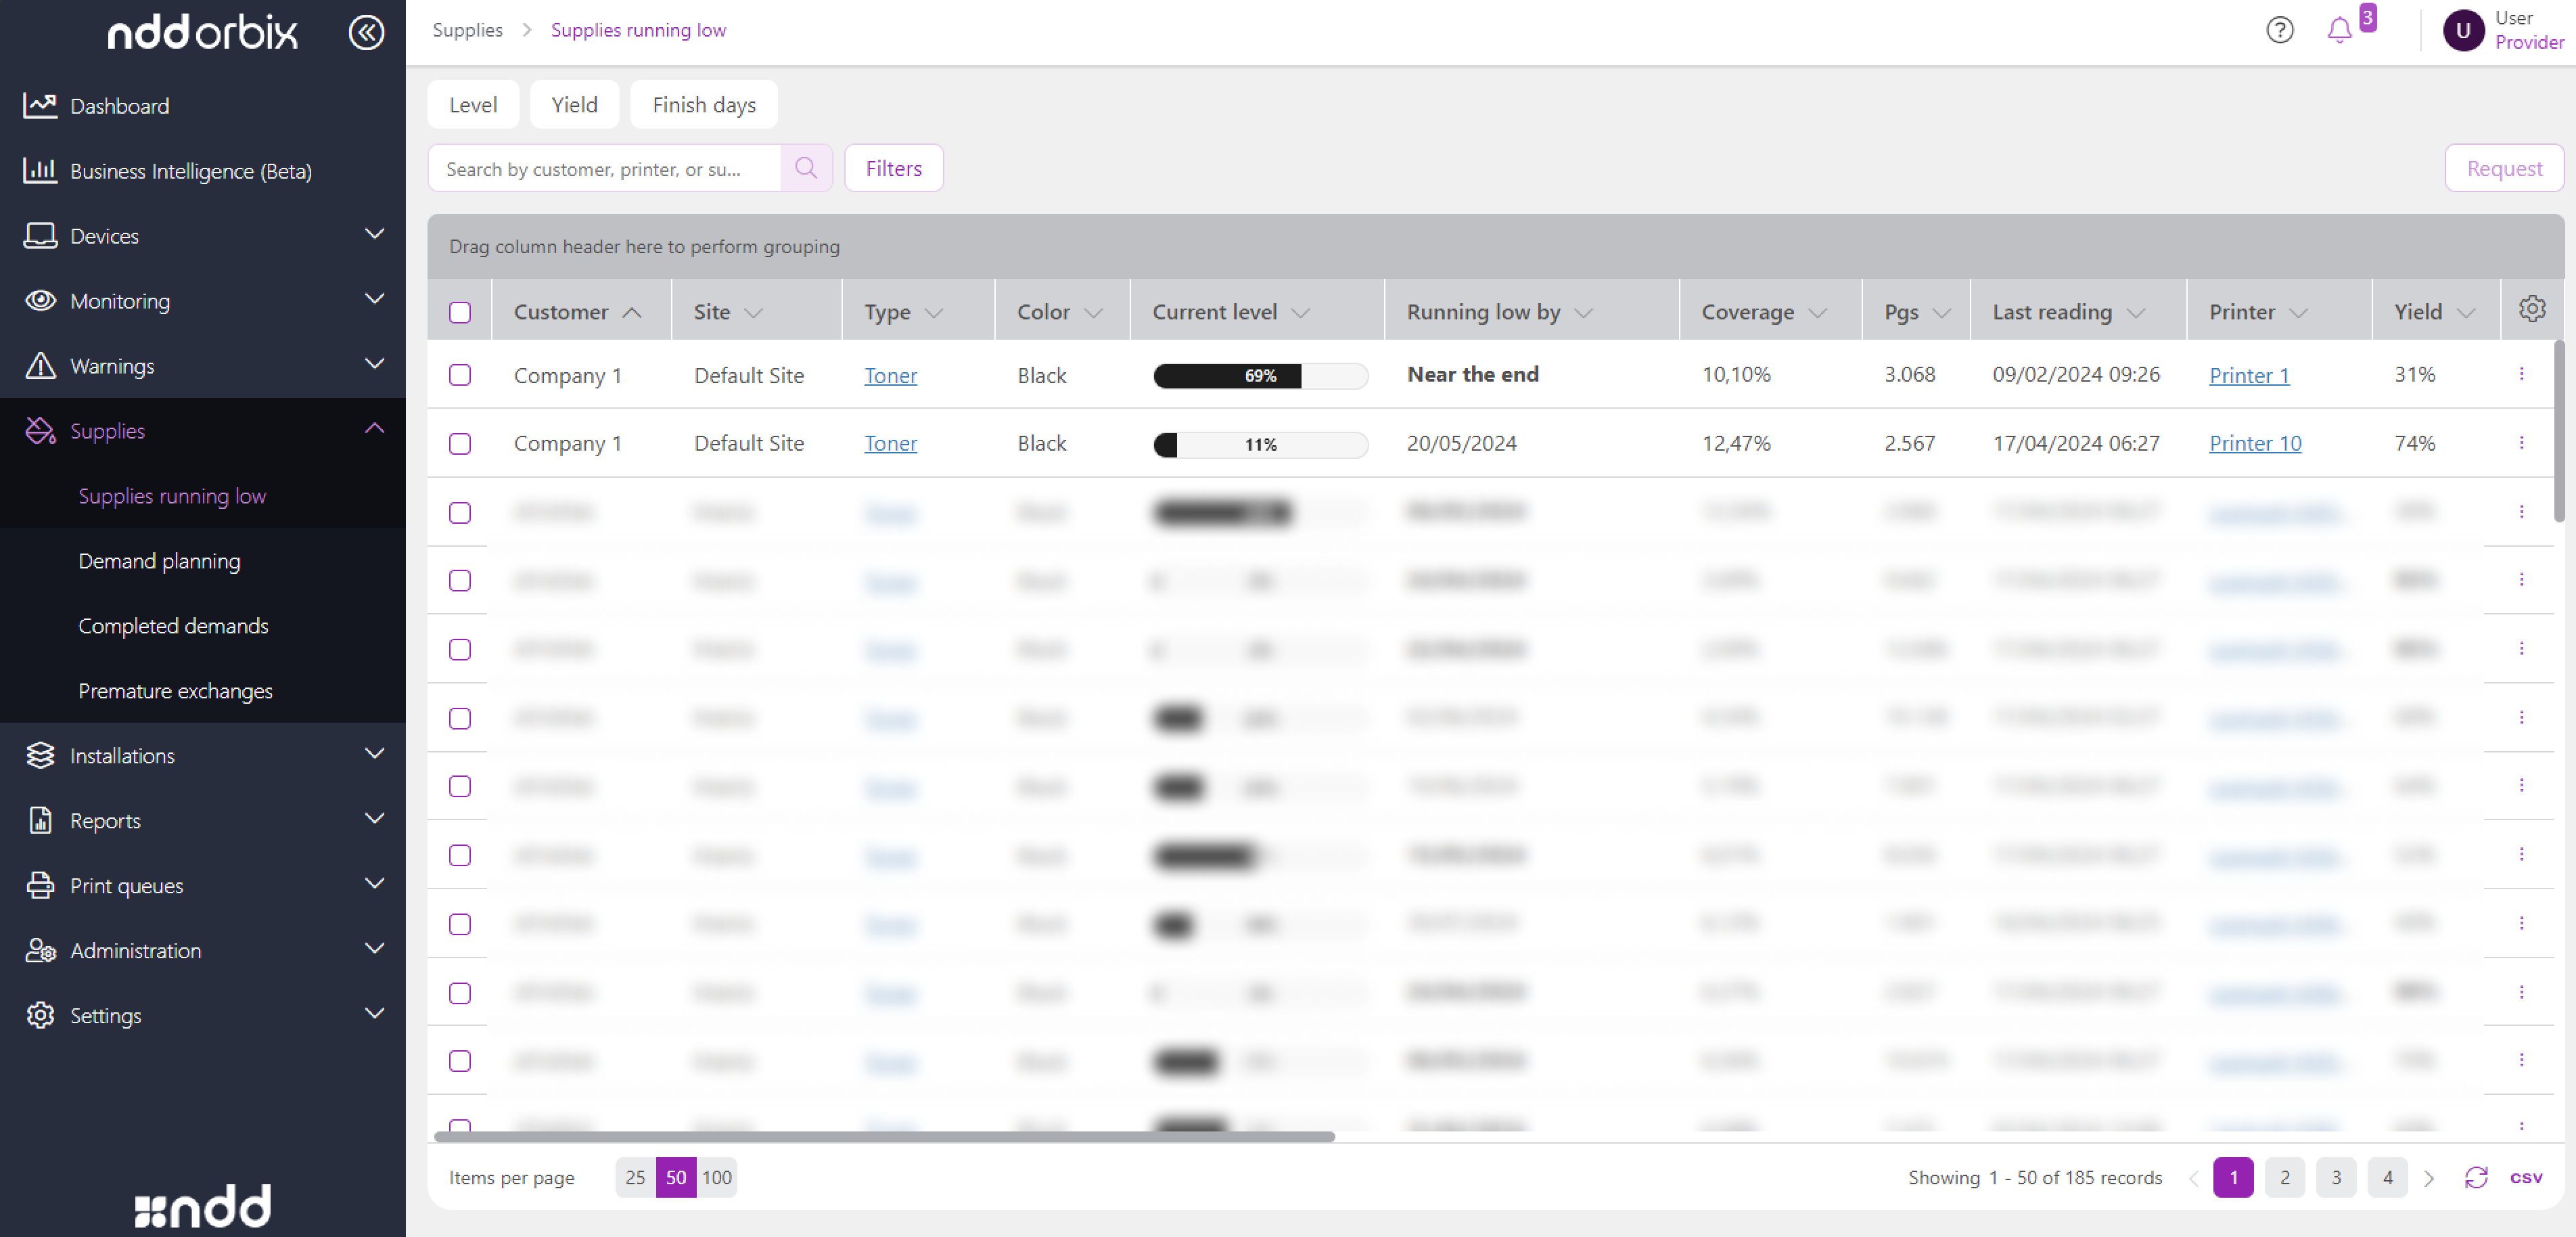
Alerts about supplies running low
This allows the provider to plan for the replacement of supplies at the right time, without letting them run low, avoiding fines and adding quality to the service provided.
The system is prepared to alert supply situations near the end through three criteria:
Level: by default, the system will alert whenever a supply is less than 25% loaded.
Running low by: an alert will be issued whenever the estimated suuply end is less than 30 days.
Yield: it will also warn that supply is nearing the end when production reaches 80%.
These rules are system standards and can be adapted to better fit the operation of each provider. To chance them, go to Create supply running low alert rule.
Once the alerts are generated, the provider will be able to analyze them and transform them into demands, which can be done through an automatic rule or manually, to then carry out the supply replacement logistics.
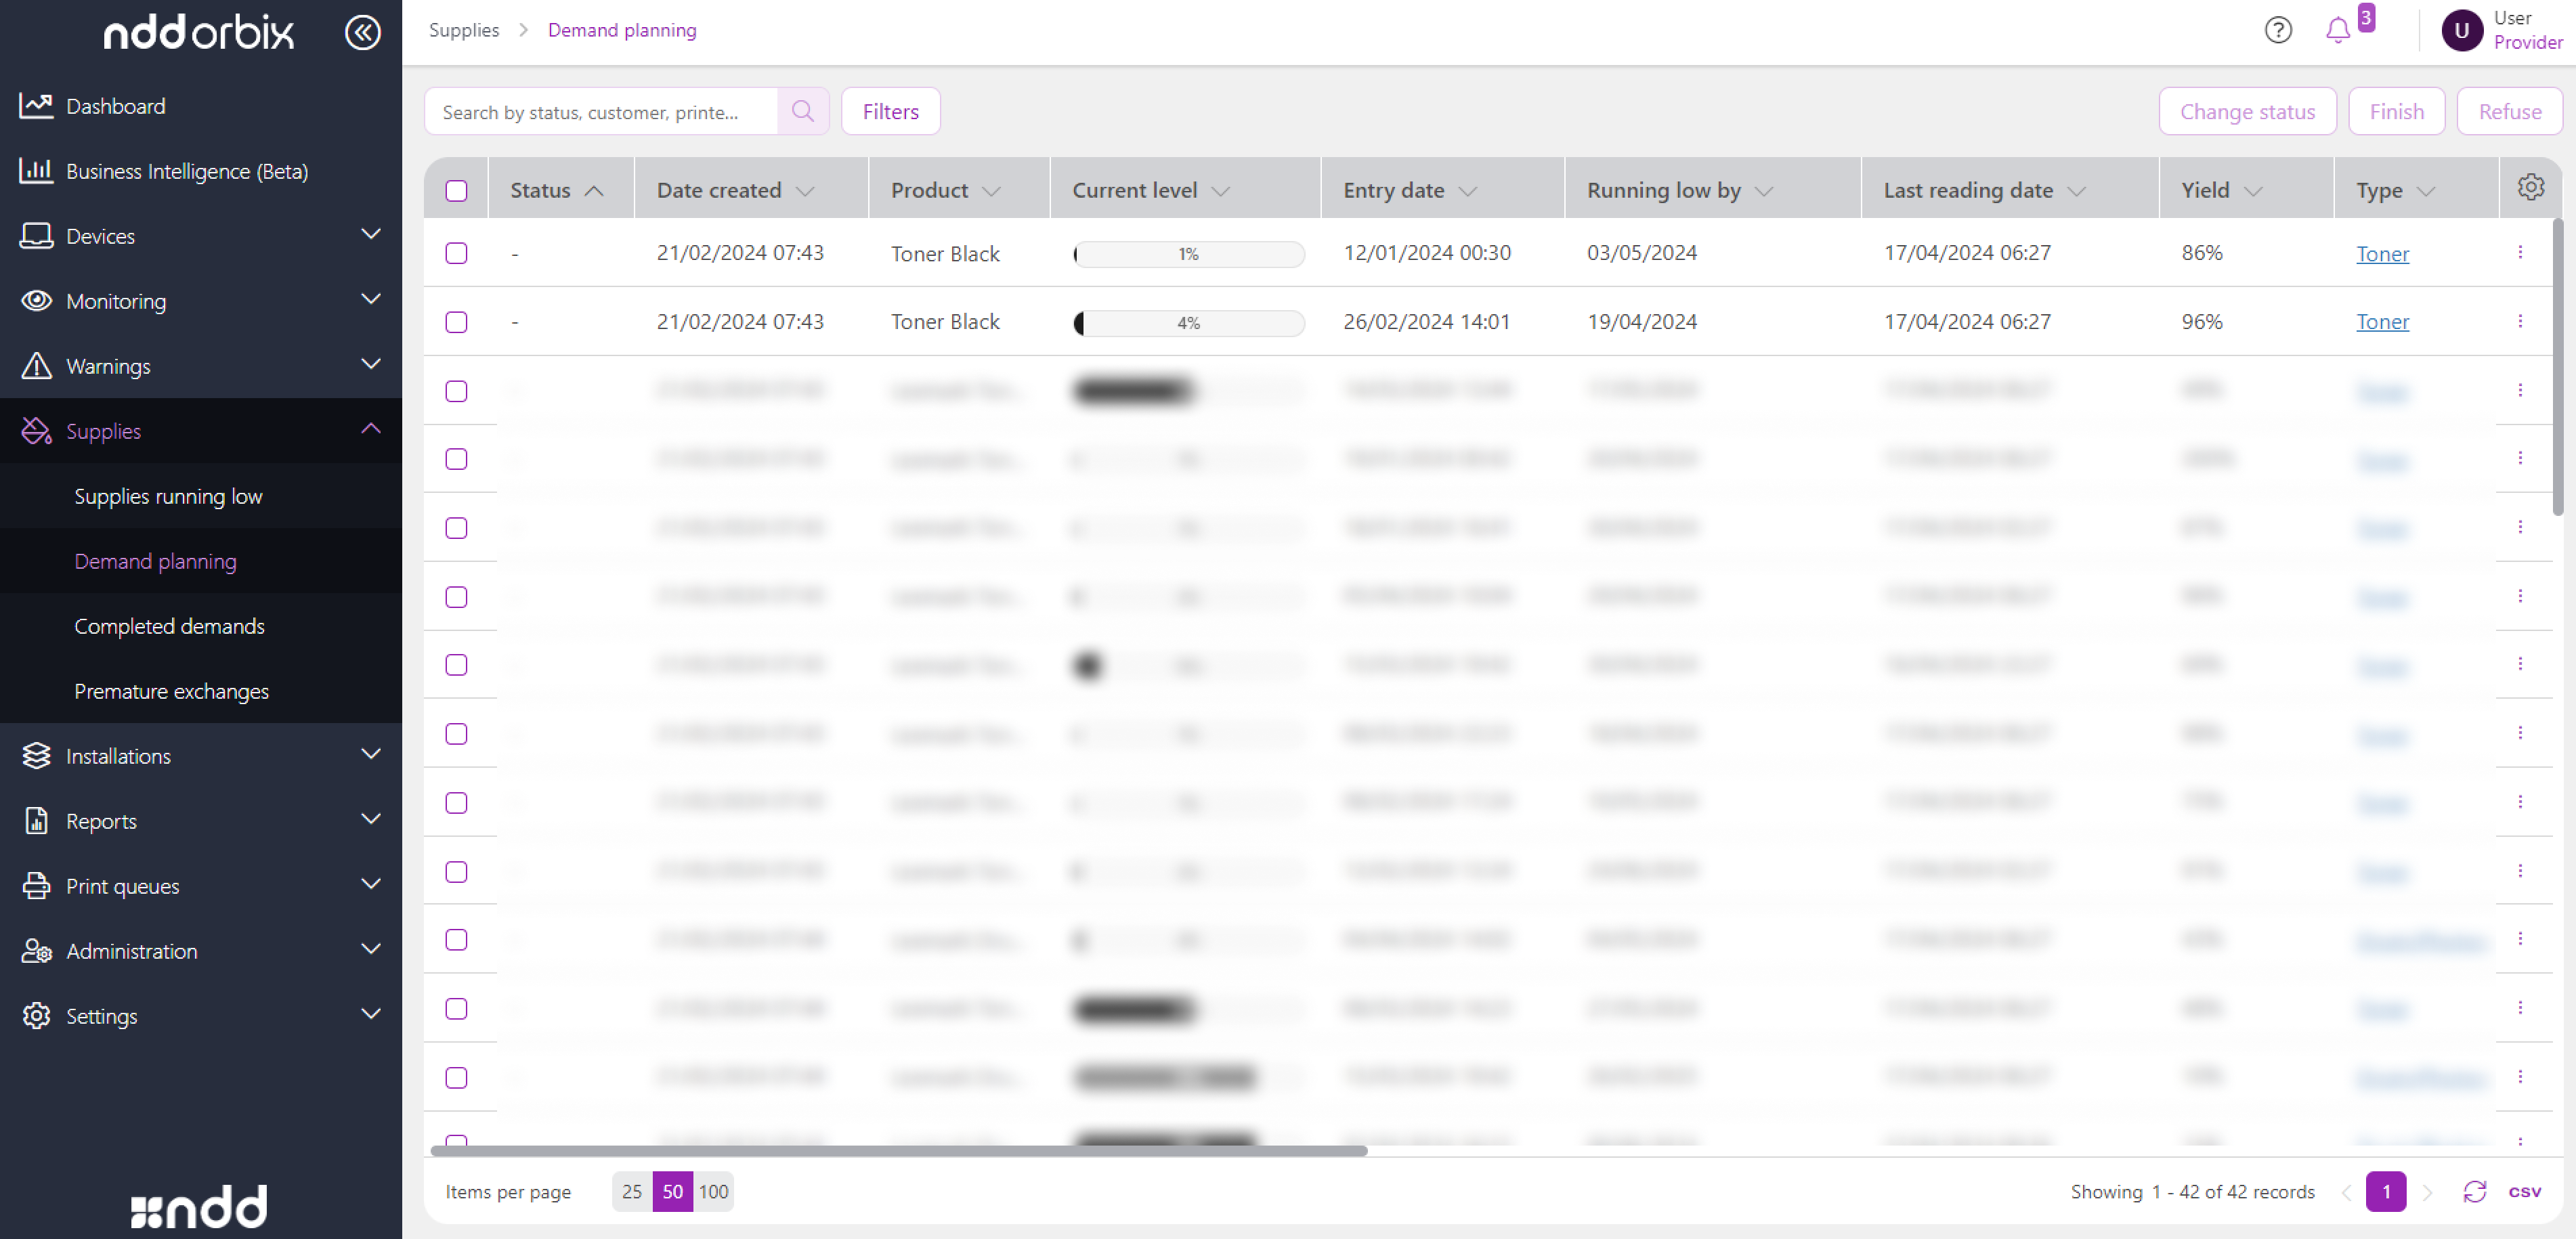
Planning demands
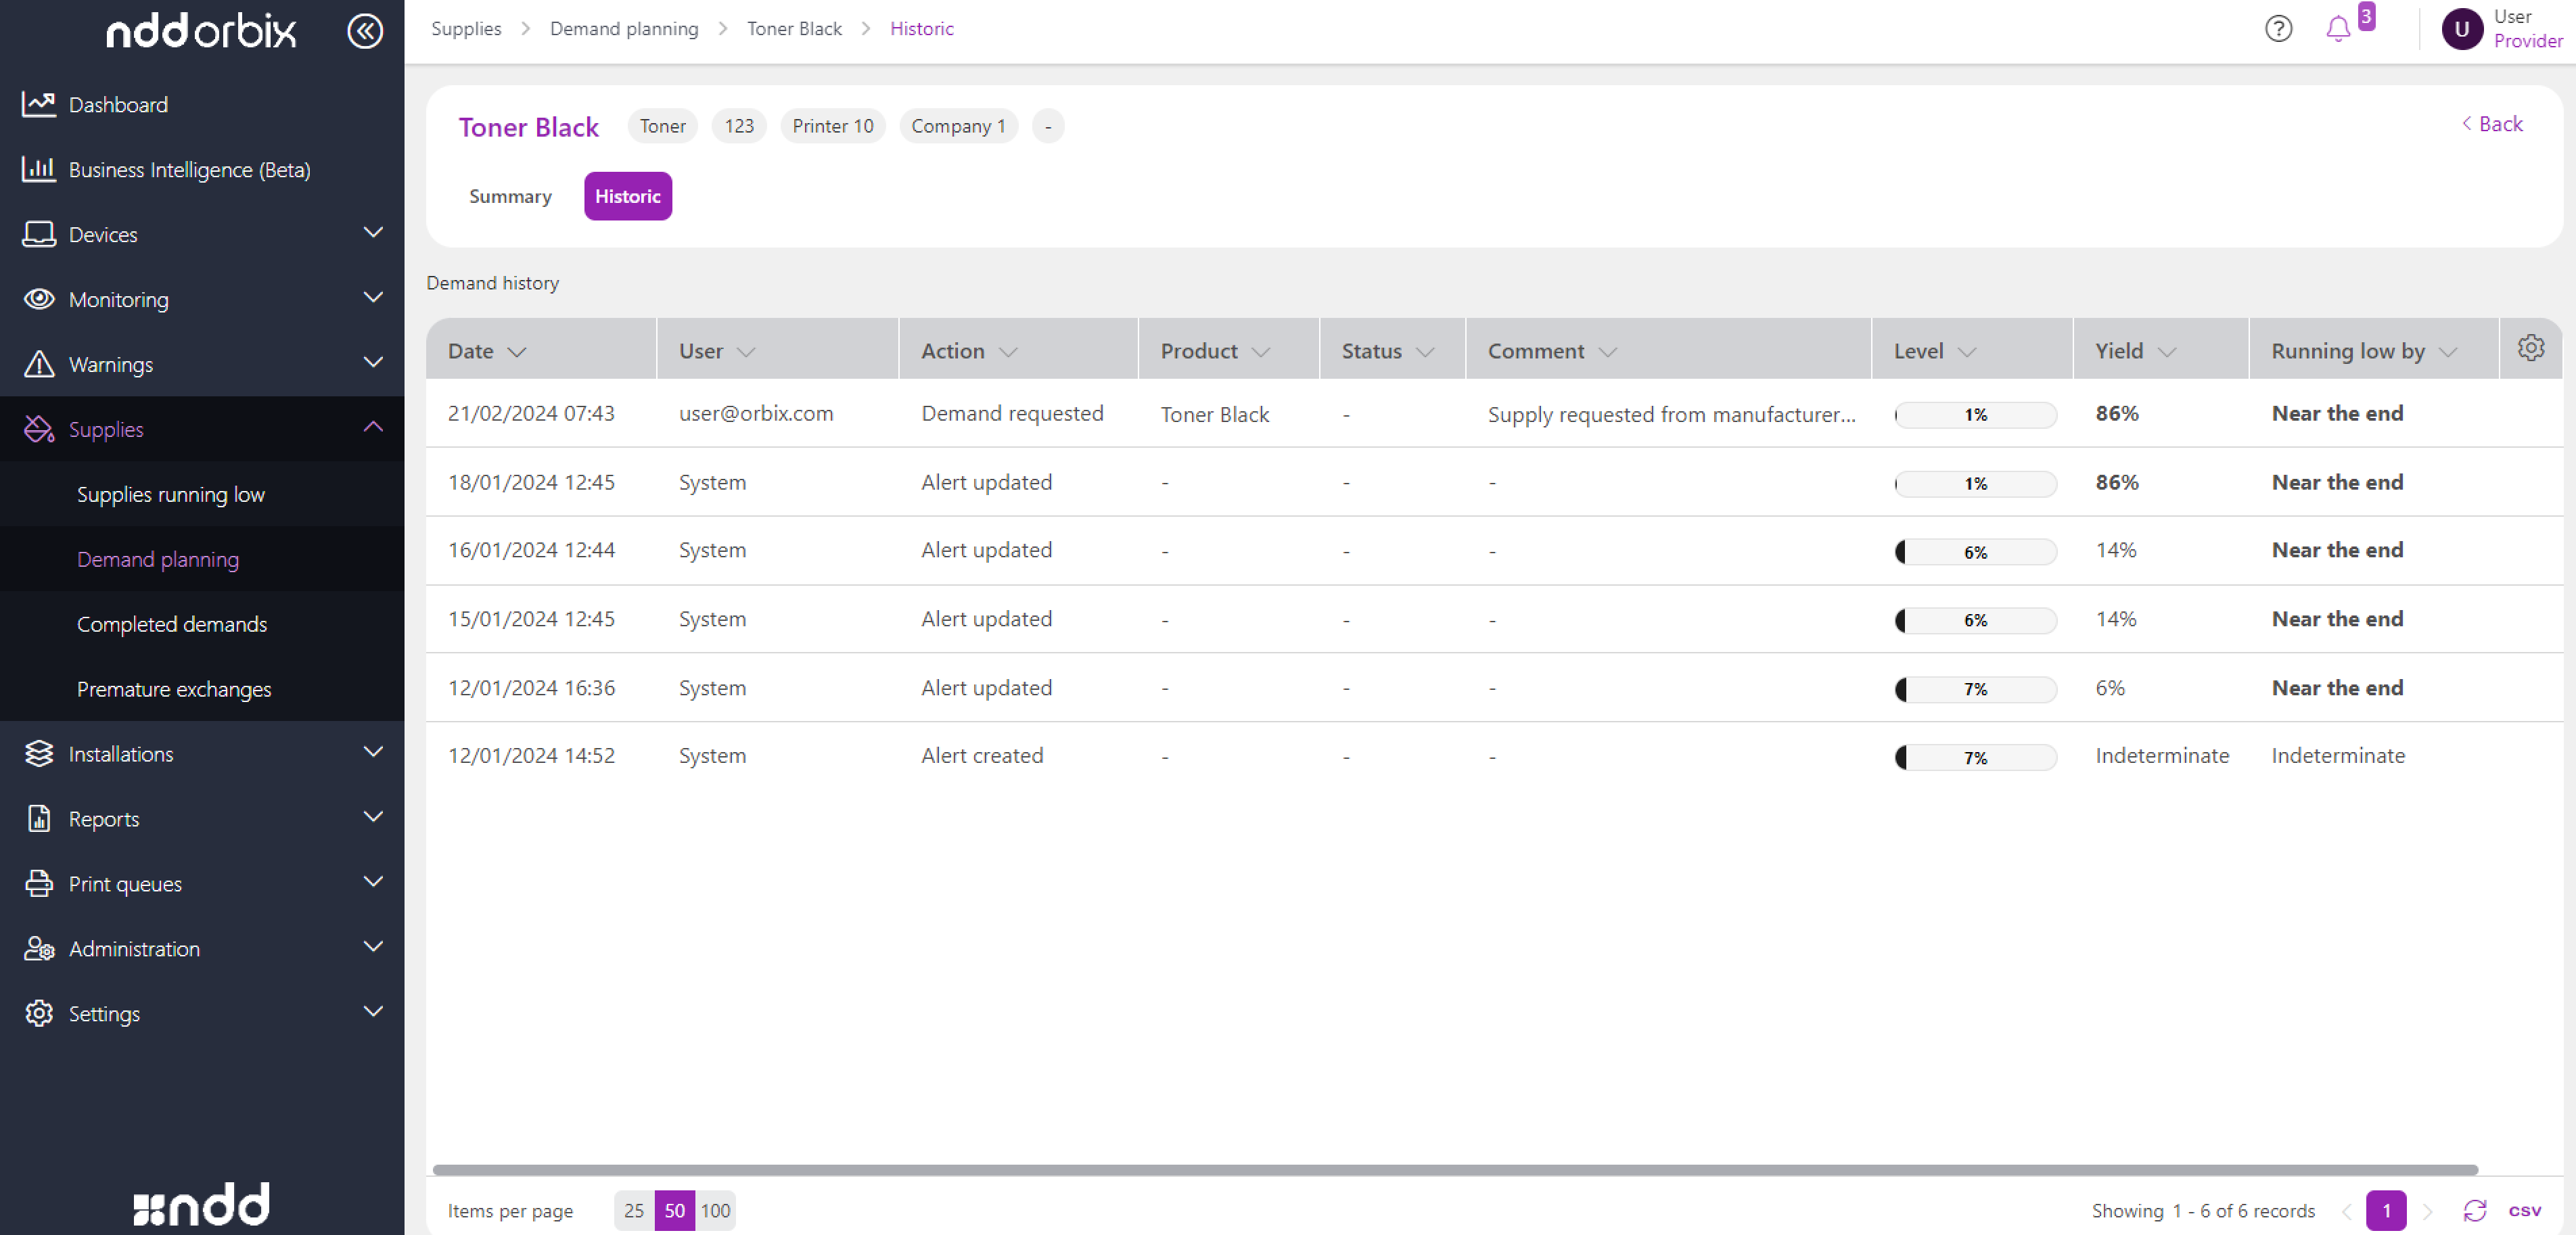
Demand planning history
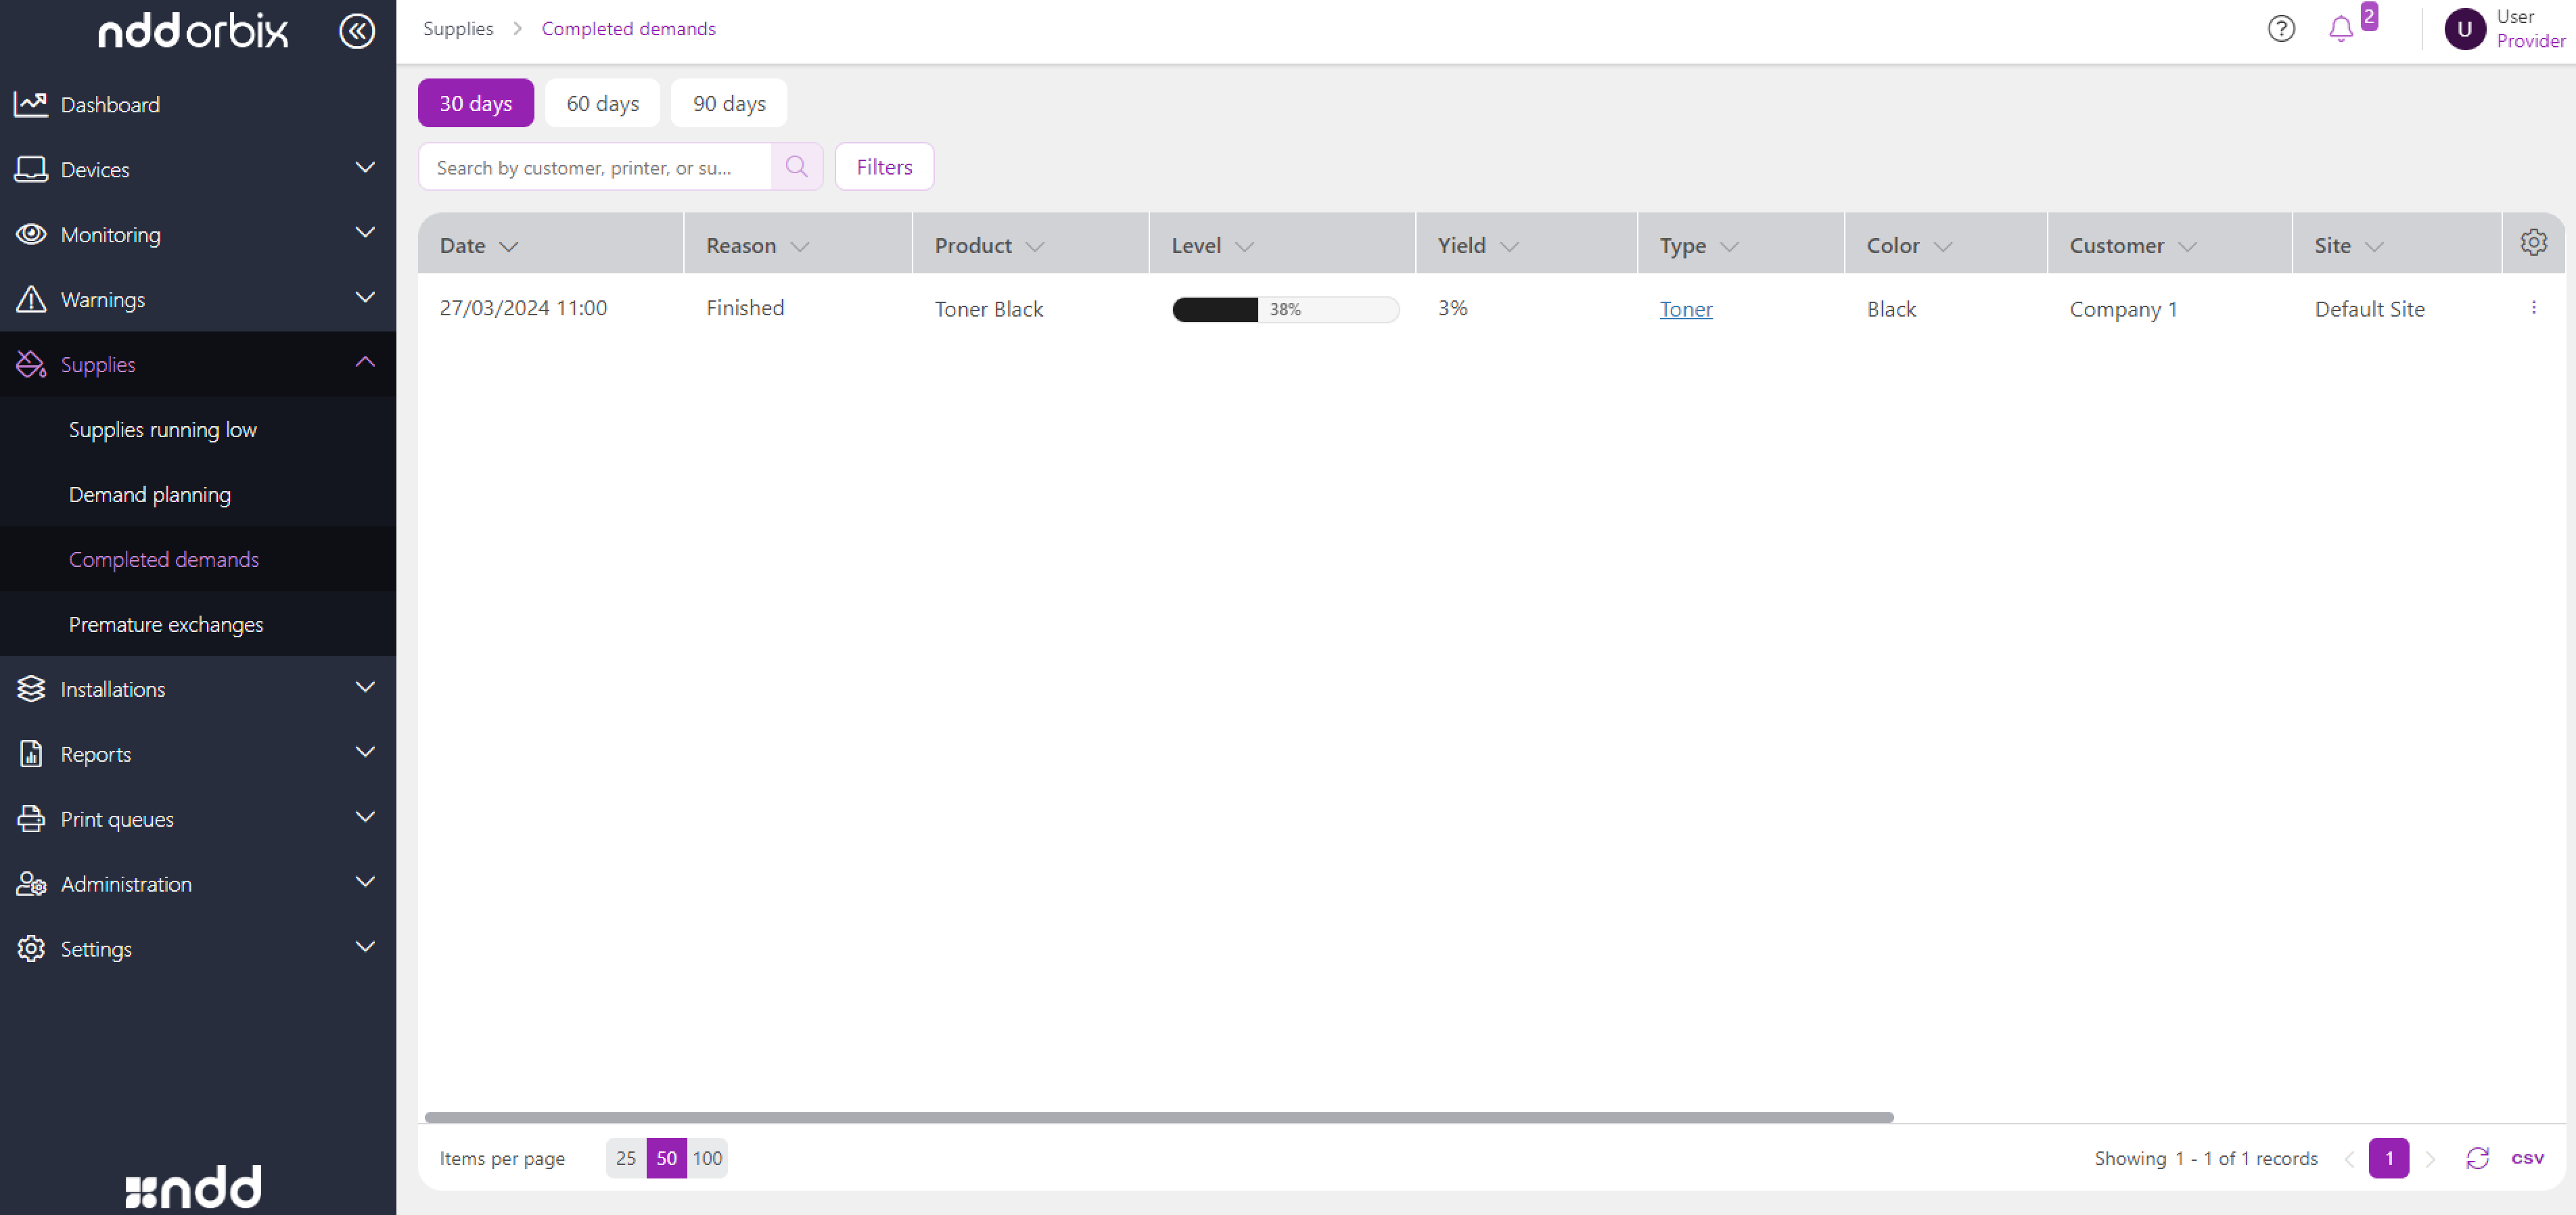
Demands that have been completed
{{component-feedback-article}}